
Sean M Muir Principle Investigator, OMS IV, BS; Andrew Brown OMS II, BS; Rizzieri Tyler OMS III
Edward Via College of Osteopathic Medicine Carolinas Campus
DOI: http://doi.org/10.70709/3gw42rn0st
Abstract
Background
Equestrian activities can be extremely dangerous and have resulted in more than 100 injuries requiring emergency department visits each year in the United States. This study aimed to investigate equestrian-related orthopedic injuries using a national database.
Methods
We compiled and retrospectively analyzed data from patients treated in emergency departments for equestrian-related injuries between 2018 and 2022. Data was obtained from the National Electronic Surveillance System (NEISS). The analysis included patient demographics such as the mechanism of injury, geographical location, age, race, and gender. Additionally, we assessed the presence of fractures, dislocations, traumatic brain injuries (TBI), orthopedic injuries, spinal injuries, and musculoskeletal injuries.
Results
Between 2018 and 2022 (5 yr. period), there were 4,760 reported equestrian-related emergency room visits. These incidents predominantly involved females (73.11%) with a median age of 31. The most affected age group was 10-19 years (32%), and these injuries often occurred during sporting events (28%). Extremity and upper trunk (thoracic-spine and ribs) fractures represented 32 and 17% of the injuries, respectively. Additionally, there were 1,075 head injuries (23%), 706 internal organ injuries (15%), 380 sprains/strains (8%), and 72 dislocations.
Conclusion
Equestrian-related injuries occur most frequently in individuals aged 10 to 19 years and are predominantly related to sporting events (i.e., Eventing, Hunting, and Jumping). Fractures of the upper and lower trunk are the most common orthopedic injuries. The elevated risk of internal injuries in equestrian activities strongly suggests the inconsistent use of inflatable safety vests while riding.
Keywords: Equestrian, orthopedic injuries, epidemiology, protective gear, public health impact, safety.
Introduction
Anyone who participates in equestrian events should be made aware of their inherent dangers and risks (1). Recent efforts to reduce human injuries have been directed towards improving helmets to better absorb impact, disperse contact surface area, and prevent or decrease the occurrence of concussions and traumatic brain injuries (2). Similarly, there has been a focus on protective inflatable safety vests that, when triggered by a contact force, provide an “airbag-like” effect, thereby reducing chest or internal injuries (2,3). While most efforts concentrate on falls from or with a horse it’s essential to recognize that delayed and chronic injuries resulting from day-to-day equestrian activities are just as likely to occur (4).
A thorough analysis of equestrian-related injuries is required in order to reduce human injuries. Surprisingly, very few studies have investigated common equestrian injuries leading to emergency department visits. The primary objectives of this study were to investigate the demographics (age, race, gender, ethnicity, etc.) and report the most frequent types of equestrian-related human injuries to provide insights for the development of prevention measures and safety protocols.
Materials and Methods
Data Collection
This study utilized the National Electronic Injury Surveillance System (NEISS), a statistically validated injury surveillance system managed by the United States Consumer Product Safety Commission (CPSC: www.cpsc.gov). NEISS’s collects and reports every national emergency department visit associated with a consumer product or toxicity. The NEISS database is user-friendly and allows individuals to query emergency visit data by website user request. Data collected can be customized by year of injury, gender, age, diagnosis, location, body part affected, mechanism of injury, and the product involved in the injury. Data for equestrian-related injuries from 2018 to 2022 were queried and analyzed based on the presence or absence of fractures, dislocations, spinal injuries, orthopedic injuries (fractures and dislocations), musculoskeletal injuries (sprains and strains), and traumatic brain injuries. Data is collected from over 100 hospitals, each with at least six beds and twenty-four-hour emergency department services. These hospitals report daily injuries and represent a stratified sample based on emergency department (annual number of emergency department visits) and geographic location. Since NEISS is a sample of hospitals, it does not provide the real number of equestrian-related emergency department visits. Instead, it provides users with a coefficient of variation that can be used to estimate the confidence interval for the true number of emergency department visits related to equestrian-related human injuries (ERHI). An estimated 215,391 (95% CI = 162,947-267,835) patients visited emergency departments in the United States for treatment of ERHI between 2018 and 2022.
Data analysis included type of injury, race, where the injury occurred, mechanism of injury and anatomical location. NEISS codes for emergency room disposition included treated and released (code 1), treated and admitted (code 2), treated and transferred (code 3), held for observation (code 5), left without being seen (code 6), unknown (code 7), and fatality/DOA/Died in ER (code 8).
Injuries included concussion, closed head injury, internal brain injury/hemorrhage, amputation (code 50), contusion (code 53), crush injury (code 54), dislocation (code 55), fracture (code 57), hematoma (code 58), laceration (code 59), nerve injury (code 61), puncture (code 63), and strain/sprain (code 64). Narrative descriptions of the injuries were cross-referenced with the code system to ensure accurate documentation. Subclassification was performed based on age, place of the injury occurred, and mechanism of injury.
Race was classified as White, Black, Asian, American Indian, Native Hawaiian, or not reported.
The place the injury occurred included unknown (code 0), home (code 1), farm (code 2), street (code 4), public (code 5), school (code 8), and sports/recreational (code 9).
The mechanism of injury was categorized into ground level incidence (injuries sustained while not riding a horse, including bites, kicks, or injuries associated with horse handling) and horse level incident (injuries involving falls, bucks, flips, being thrown, or other injuries associated with riding a horse).
Injuries were categorized anatomically using 93 distinct NEISS codes, which were translated into various categories covering shoulder/upper arm, elbow/forearm, hand/wrist, head/neck, chest, pelvis, hip/upper lower extremity, knee/leg, foot/ankle, and internal organ injuries. Individuals who sustained injuries affecting multiple anatomical regions were identified as having multiple bodily injuries. These injuries were grouped into the following categories: upper extremity (encompassing shoulder/upper arm, elbow/forearm, hand/wrist), head/neck, trunk (including chest and pelvis), lower extremity (comprising hip/upper lower extremity, knee/leg, foot/ankle), internal organ injuries, and general bodily injuries. The appendicular body included the upper and lower extremities, whereas the axial body encompassed the chest, abdomen, pelvis, and spine.
Statistical Analysis
Group comparisons were conducted using a student’s t-test for two groups or analysis of variance (ANOVA) for three or more groups (p-value <0.05). Nonparametric tests included the Mann-Whitney U-test for two groups or the Kruskal-Wallis test for three or more groups when group s were small (n < 30) or exhibited non-normal distributions. Discrete data were presented as frequencies and percentages, while continuous data were expressed as the mean ± standard deviation. Paired measurements were analyzed using paired tests, and differences between groups of discrete data were assessed using Pearson’s chi-squared test or Fisher’s exact test when the frequency was <5. Continuous data are reported to three significant figures and percentage values are reported to the nearest whole number.
Results
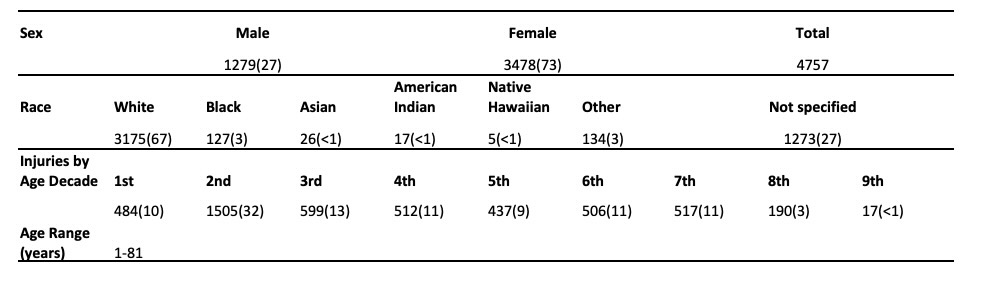
A total of 4,760 equestrian-related emergency room visits were reported between 2018 and 2022. The majority of these injuries occurred in females, comprising 3,478 cases (73%), while males accounted for 1,279 cases (27%). The ages of those affected ranged from 1 to 86 years. The median age of the injured individuals was 31.0 with a mode of 17 years. Notably, 1,506 individuals (32%) were in the second decade of life (10-19 years). The most frequent place of injury was during a sporting or recreational event (i.e., sports/recreational: code 9), with 1,339 cases (28.15%).
In terms of race, white individuals constituted the largest group, with 3,175 cases (67%). The distribution among other racial groups was as follows: 1,273 (27%), 134 (3%), 127 (3%), 26 (1%), 17 (> 1%: 0.36%), and 5 (> 1%: 0.11%) cases were categorized as unknown, other, Black, Asian, American Indian, and Native Hawaiian, respectively.
The most common injuries included head injuries, accounting for 1,075 cases (22.60%), followed by lower trunk injuries in 780 cases (16.40%), upper trunk injuries in 629 cases (13.22%), shoulder injuries in 319 cases (6.71%), and wrist injuries in 207 cases (4.35%). The diagnoses included fractures in 1,564 cases (32.88%), contusions in 751 cases (15.79%), internal injuries in 706 cases (14.84%), other injuries in 610 cases (12.82%), sprains in 380 cases (7.99%), and concussions in 356 cases (7.48%).
The most common mechanism of injury was a horse-level event, such as a buck, fall, or being thrown, accounting for 4,671 cases (98.2%). Only 86 cases (1.8%) involved ground-level injuries.
The majority of individuals (3,759) were treated, examined, and released from the emergency department, while 793 were treated and admitted. Ninety-four individuals were treated and transferred, 55 were held for observation, 54 left against medical advice or without being evaluated, and one patient died.
Fracture patterns
Fractures were the most common injury type, affecting 1,564 individuals (Figure 1). The upper trunk (T-spine and ribs) was the most common location for fractures, accounting for 267 cases (17%). Other fracture locations included the lower trunk (L-spine, femoral neck, and pelvis) with 261 cases (17%), forearm with 150 cases (10%), wrist with 140 cases (9%), shoulder with 134 cases (9%), humerus with 126 cases (8%), lower leg with 91 cases (6%), ankle with 73 cases (5%), elbow with 71 cases (5%), face with 60 cases (4%), finger with 42 cases (3%), femoral shaft with 37 cases (2%), foot with 23 cases (1%), neck/c-spine with 22 cases (1%), knee with 18 cases (1%), and toe with 4 cases (<1%). Zero open fractures were reported. Further investigation revealed 43 T-spines and 207 rib fractures in the upper trunk. In the lower trunk, there were 71 L-spine, 3 femoral neck, 36 pelvic, and 32 hip fractures.
When investigating fractures by age (Figure 2), it becomes evident that individuals in their 6th decade (44%) and 7th decade (43%) have the highest prevalence. On the other hand, younger individuals may have a lower likelihood of sustaining fractures but a higher likelihood of experiencing strains, contusions, or concussions (as detailed below). Interestingly, older individuals in the 6th and 7th decades were also more likely to sustain upper trunk, lower trunk, or lower extremity injuries, while younger individuals in the 1st and 2nd decades had a higher chance of wrist, humerus, or forearm fractures. Additionally, fractures in the 6th decade (225 females and 60 males) and the 7th decade (224 females and 77 males) were more common among women than men.
Dislocation Patterns
Dislocations were the 8th most common injury occurring in 72 individuals (1.51%). These included 32 (44%) shoulder dislocations, 16 (22%) finger dislocations, 10 (14%) elbow dislocations, 8 (11%) knee dislocations, 3 (4%) hip dislocations, 1 (1%) metatarsal dislocation, and there were no reported wrist or ankle dislocations (Figure 3).
When investigating dislocations across age groups more dislocations occurred in older individuals, similar to fractures, specifically in the 6th and 7th decades of life (Figure 2). There was no association found between sex, location of dislocation, and the risk of dislocation.
Sprain patterns
Sprains and strains were the 5th most common injury, accounting for 68 individuals (18%) with injuries to the lower trunk (L-spine, femoral neck, and hip), 67 cases (18%) with neck sprains, 59 cases (16%) with ankle sprains, 57 cases (15%) with shoulder sprains, 48 cases (13%) with wrist sprains, 24 cases (6%) with knee sprains, 21 cases (6%) with upper trunk (T-spine and ribs) sprains, 11 cases (3%) with foot sprains, 6 cases (2%) with finger sprains, 3 cases (1%) with elbow sprains, 2 cases (1%) with lower leg sprains, and no reported toe sprains (Figure 4).
When examining the distribution of strains by age, individuals in the 2nd (10%), 3rd (10%), and 4th (10%) decades of life exhibited the highest rates of sprains in terms of the percentage of injuries within their respective age groups (Figure 5). These decades also show the highest rates of contusions at 17%, 20%, and 19%, respectively. Furthermore, there was a higher percentage of individuals sustaining sprains of the ankle, shoulder, and upper and lower trunk areas, during the second decade of life (Figure 2).
Concussions
A total of 356 individuals sustained concussions, 311 were female and 45 were male. Among these, 339 individuals experienced concussions due to horse-related incidents “horse-level injury” (falls, throws, or bucks), while only 17 sustained ground-level concussions. Of those with concussions, only 82 individuals were documented as wearing a helmet. Notably, all 82 individuals wearing helmets and diagnosed with concussions had suffered horse-level injuries. 77 were female, and 5 were male.
Ten individuals sustained concussions after horse-level injuries were not wearing a helmet. Nine were female, and one was male., There was no information for the remaining 247 individuals who sustained concussions from horse-level injuries regarding whether or not they wore helmets.
A total of 106 individuals experienced concussions during recreational or sporting events, 41 were at home, 167 occurred at an unknown location, 21 happened on a farm, and 14 took place in a public setting.
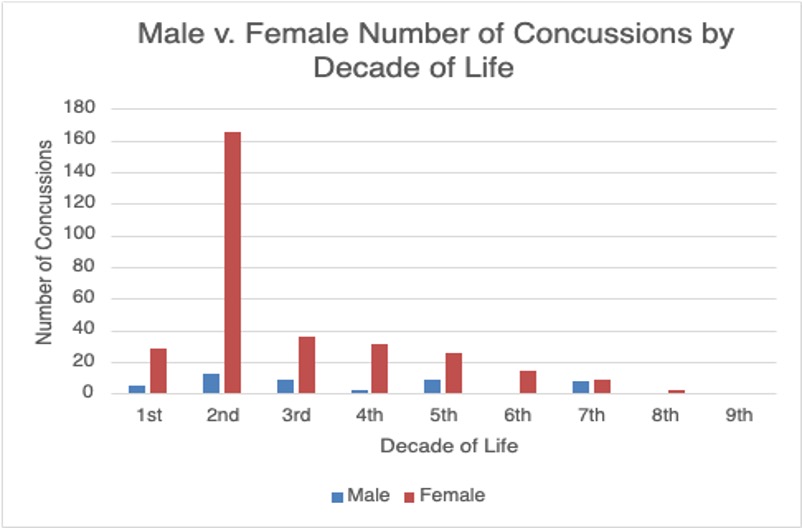
The incidence of concussions decreased with age. Of the 177 individuals (12%) who sustained concussions in 2nd decade of life, 165 were female and 12 males. Forty-five individuals (8%) experienced concussions during the 3rd decade of life, 36 were female and 9 were male; 14 females (3%) and zero males sustained a concussion during their 6th decade of life (Figure 6).
Internal Injuries
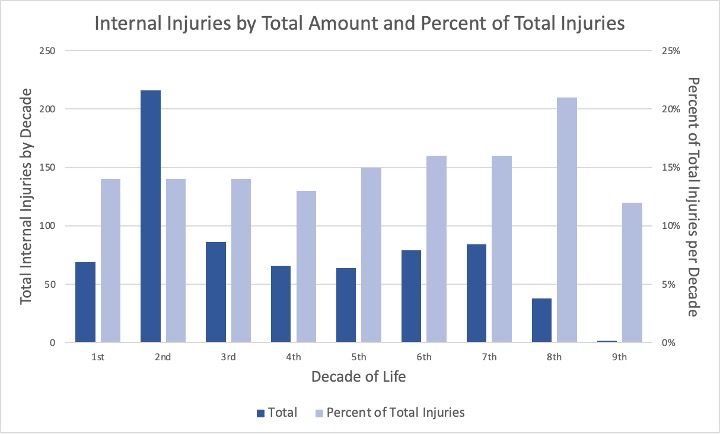
Internal injuries were the 3rd most common malady, seven hundred and six individuals (14.84%) experienced internal injuries, 541 were female and 165 were male. Six hundred and ninety-seven were due to horse-level injuries, and only four individuals were reported to be wearing inflatable safety vests for protection. Among the internal injuries, 206 occurred during sporting events, 106 at home, 314 at unknown locations, 40 on farms, and 31 in public settings. Internal injuries were prevalent across all age groups, with the highest prevalence observed in the 8th decade (Figure 2 and Figure 7).
Discussion
The NEISS database reported 4,760 equestrian-related emergency visits between 2018 and 2022. The majority (73%) of visits were female. The median age of injury was 31, and the most common racial group was white. Most of these injuries occurred at sporting events and farms. The most common body part injured was the head, followed by the lower and upper trunk. The most common orthopedic injury was a fracture. The majority of injuries occurred while riding a horse and were associated with falls, bucks, or being thrown from a horse.
Younger individuals were more likely to sustain strains or contusions while older individuals, especially women, had a higher incidence of trunk injuries, including C-spine, ribs, pelvis, T-spine, and L-spine injuries. In contrast, individuals in the 1st and 2nd decades of life were more likely to experience injuries of the wrist, forearm, and humerus. This could be attributed to the agility of younger individuals instinctively using their hands to protect themselves during falls, resulting in the classic FOOSH (fall on outstretched hand) injury pattern. The higher incidence of trunk injuries in older individuals may be linked to conditions like osteoporosis, which is more prevalent in post-menopausal women over the age of 65. Osteoporosis often affects the vertebrae, predisposing to T and L spine fractures during a fall from a horse. A whiplash-like mechanism could also lead to scalene strain and cervical spine tenderness. Furthermore, a higher incidence of internal injuries was noted in the 7th decade, possibly suggesting more severe falls in older individuals.
Surprisingly, dislocations were less common than expected and ranked 8th in terms of frequency. Shoulder dislocations were most common during the 6th and 7th decades of life. There was no significant association between sex, the location of dislocation, and the risk of dislocation. This suggests that dislocations occurred at all locations without a strong gender-specific pattern.
Sprains and strains were less common than anticipated. These were most commonly found in the lower trunk (L-spine, hip, and pelvis). Two possible explanations for lower trunk strains are blunt trauma following falls from horses or twisting during falls or ejections from the saddle. The trunk and spine endure the most force during injuries.
Fortunately, only ten individuals who sustained a concussion were documented as not wearing a helmet, indicating effective helmet enforcement. A total of 356 individuals sustained concussions, with 311 of them female and 45 males. Most of these injuries occurred during sporting events after falling from a horse. Interestingly, Figure 2 demonstrates that the prevalence of concussions decreases as age increases. The most common age groups to sustain concussions are the 2nd and 3rd decades. The reasons for the decrease in concussions with age are unknown but likely related to experience and horsemanship. An earlier study found a concussion rate of 44%. The drop from 44% to 7.56% may be related to the use of helmets protecting individuals from sustaining a concussion (5–9).
There was an increase in internal injuries with age. Importantly, only four out of 697 individuals were wearing a safety vest at the time of injury. This suggests that all, especially inexperienced, horseback riders should wear an inflatable safety vest while riding or attending to horses. This also suggests that equine businesses should require riders to always wear vests (3,10).
A review of the National Electronic Injury Surveillance System database between 2002 and 2004, identified 5,033 emergency room visits associated with horse related events 9. The majority of injuries occurred at home (36%), while others occurred during recreational activities or sporting events (30%), and on farms (19%) 9. The most common type of injury was contusion (31%), followed by fractures (28%), sprains/strains (18%), and traumatic brain injuries (TBIs) (12%) 9. The primary locations of injury were the upper extremity (30%), trunk (29%), head and neck (24%), and lower extremity (16%) 9. This study further examined the predictors of hospital admissions, which included fractures, age over 18, TBIs, and injuries occurring on public property.
Limitations
Similar to other studies using the NEISS reporting database, our analysis is subject to certain inherent limitations that include retrospective analysis, in concise narratives, and limited coding specificity, potentially restricting data interpretation and introducing the possibility of bias. Notably, NEISS represents a sample of visits to emergency departments and may underestimate the actual number of injuries since it does not account for individuals seeking care in other healthcare settings or those not seeking formal care at all.
Figure 1 | Figure 2 | Figure 3 | Figure 4 | Figure 5 | Figure 6 | Figure 7 | Figure 8
Required Disclosures and Declaration
Copyright Information: No Copyright Information Added
IRB Approval Information: Not applicable
Disclosure Information: No known conflicts of interest
References
- Thompson K, McGreevy P, McManus P. A Critical Review of Horse-Related Risk: A Research Agenda for Safer Mounts, Riders and Equestrian Cultures. Animals (Basel). 2015;5(3):561. doi:10.3390/ANI5030372
- Chapman M, Thompson K. Preventing and Investigating Horse-Related Human Injury and Fatality in Work and Non-Work Equestrian Environments: A Consideration of the Workplace Health and Safety Framework. Animals (Basel). 2016;6(5):33. doi:10.3390/ANI6050033
- Gates JK, Lin CY. Head and Spinal Injuries in Equestrian Sports: Update on Epidemiology, Clinical Outcomes, and Injury Prevention. Curr Sports Med Rep. 2020;19(1):17-23. doi:10.1249/JSR.0000000000000674
- Hoffmann MF, Bernstorff M, Kreitz N, Roetman B, Schildhauer TA, Wenning KE. Horse-related injury patterns: a single center report. J Orthop Surg Res. 2023;18(1):83. doi:10.1186/S13018-023-03549-3
- Kuhl HN, Ritchie D, Taveira-Dick AC, Hoefling KA, Russo SA. Concussion History and Knowledge Base in Competitive Equestrian Athletes. Sports Health. 2014;6(2):136. doi:10.1177/1941738113508073
- Van Balen PJ, Barten DG, Janssen L, Fiddelers AAA, Brink PR, Janzing HMJ. Beware of the force of the horse: mechanisms and severity of equestrian-related injuries. Eur J Emerg Med Off J Eur Soc Emerg Med. 2019;26(2):133-138. doi:10.1097/mej.0000000000000511
- Thomas KE, Annest JL, Gilchrist J, Bixby-Hammett DM. Non-fatal horse related injuries treated in emergency departments in the United States, 2001–2003. Br J Sports Med. 2006;40(7):619-626. doi:10.1136/bjsm.2006.025858
- Current Trends Injuries Associated with Horseback Riding – United States, 1987 and 1988. Accessed October 22, 2023. https://www.cdc.gov/mmwr/preview/mmwrhtml/00001626.htm
- Loder RT. The demographics of equestrian-related injuries in the United States: injury patterns, orthopedic specific injuries, and avenues for injury prevention. J Trauma. 2008;65(2):447-460. doi:10.1097/TA.0B013E31817DAC43
- Andres SA, Bushau-Sprinkle AM, Brier ME, Seger YR. Effects of body protection vests and experience levels in prevention of equestrian injuries. BMJ Open Sport — Exercise Medicine. 2018;4(1):426. doi:10.1136/BMJSEM-2018-000426
